PERT, Beta, & Three-Point Approximation
21 Sep 2019I recently took a Project Management Professional (PMP) course that covered cost and schedule estimation. According to Project Management Insitute’s (PMI) Project Management Body of Knowledge (PMBOK), statistically-based estimate methods can be either parametric estimation or three-point estimate1.
Parametric estimation, as you may have guessed, involves using the normal distribution. However, the methodology in PMBOK is not so scientific. Parametric estimation in their case is simply using linear estimation to predict a future cost. An example of this would be if Project X used \(10\) widgets at a cost of \(10\) each, and our project uses \(20\) widgets, we estimate the cost to be \(20\). Not so scientific, but certainly appropriate in certain situations.
What piqued my interest was the alternative methodology, known as a three-point estimate. The three-point estimate can be broken into two categories, one using the triangular distribution, with the other using the beta distribution (PERT method).
For the PERT methodology, the text suggests estimating parameters to produce a beta distribution which can be approximated by the normal distribution. In effect, you estimate a mean and standard deviation from your optimistic, most likely, and pessimistic estimates and use z scores to draw a tolerance interval. By its very definition (and every example they gave in the course), the three-points would produce an asymmetric distribution—otherwise, why not just estimate with a mean and standard deviation?
What wasn’t clear to me was how to bridge the gap between using parametric estimators to characterize asymmetric distributions. After some research, I ran into a book2, and a corresponding website3 that explained how the PERT distribution is derived.
As it turns out, the PERT methodology uses a beta distribution function to smooth out this three-point estimate into a normal-ish distribution or a lognormal distribution2. It does this by taking the three parameters and converting them into \(a_1\) and \(a_2\), the shape parameters used to create the beta smoothing.
The relationship between the two distributions can be defined as3
\[\text{PERT}(a,b,c)=\text{Beta4}(a_1,a_2,a,c)\]Where \(a\) is the optimistic estimate, \(b\) is the most likely estimate, and \(c\) is the pessimistic estimate.
\[a_1 = \frac{(\mu-a)(2b-a-c)}{(b-\mu)(c-a)}\] \[a_2 = \frac{a_1(c-\mu)}{\mu-a}\] \[\mu = \frac{a + \lambda b+c }{\lambda + 2}\]Note: \(\lambda\) is usually \(4\), but from my research seems arbitrarily chosen and serves the sole purpose of weighing the most likely estimate higher than the other two.
So lets plug in some numbers here and start modeling this in R. For our model, lets say we have an activity that we estimate to cost \(a=200\), \(b=600\), \(c=1500\).
set.seed(1234)
a = 200 # optimistic
b = 600 # most likely
c = 1500 # pessimistic
lambda = 4 # arbitrary
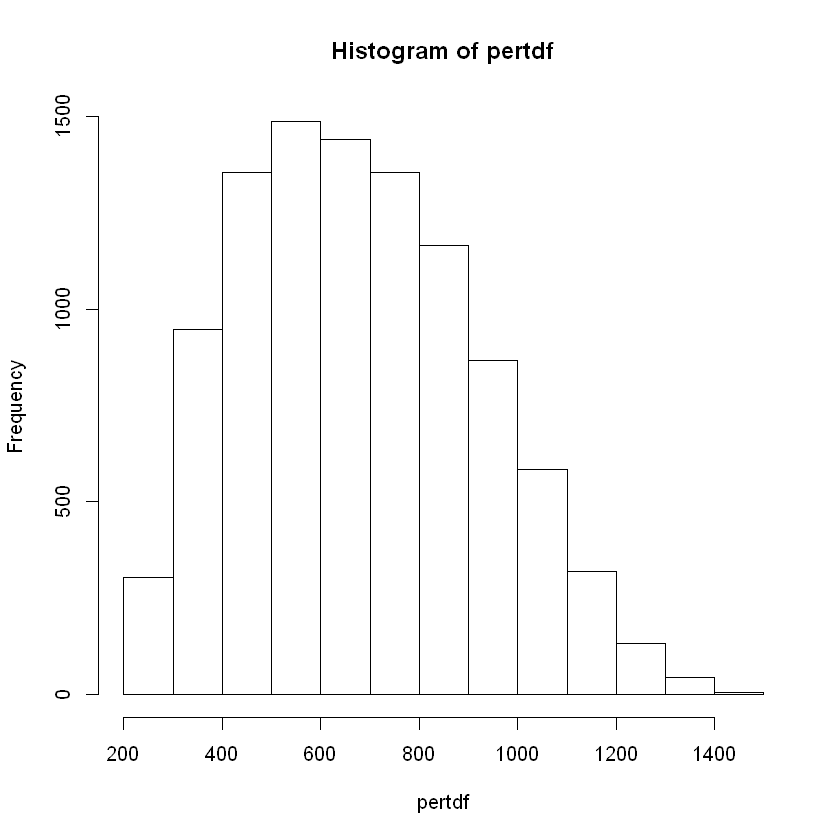
To convert the parameters we have into a beta-smoothed PERT distribution, we need to define our shape parameters and generate some values. This can be achieved by calculating the shape parameters per Vose’s methodology3 and then scaling each sample by the range and offsetting by the optimistic estimate (see footnote link for their R code)2. We need to generate at least \(10000\) samples to get a good idea of the shape of the distribution. I also took the liberty of rounding to two decimal places to make everything a bit more readable.
pert <- function(a, b, c, lambda) {
  mu = (a + lambda * b + c) / (lambda + 2)
  a1 = ((mu - a) * (2 * b - a - c)) / ((b - mu) * (c - a))
  a2 = (a1 * (c - mu)) / (mu - a)
  data = rbeta(10000, a1, a2)
  return(round(data * (c - a) + a, digits = 2))
}
If you run the function and get the quantiles (I chose \(.05, .50, .95\)) you get 5% 323.94 50% 663.6 95% 1100.46.
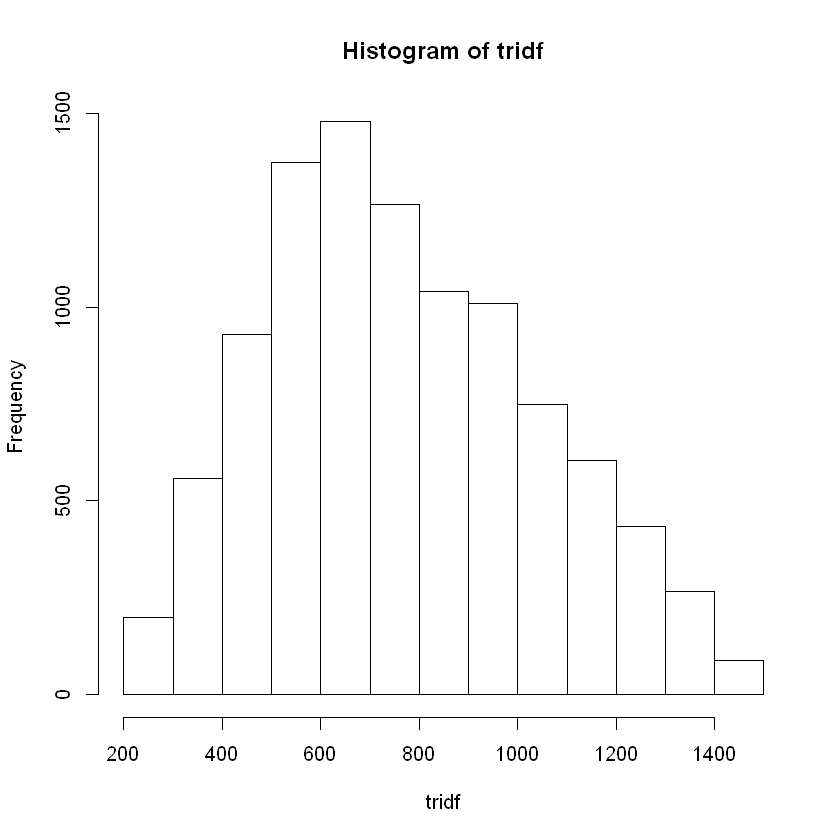
To get the triangular distribution with our parameters, you can simply use the rtri function from EnvStats4.
library(EnvStats)
tridf <- round(rtri(n = 10000, a, c, b), digits = 2)
quantile(tridf, c(.05, .50, .95))
We get the following quantiles 5% 361.325 50% 735.87 95% 1259.053.
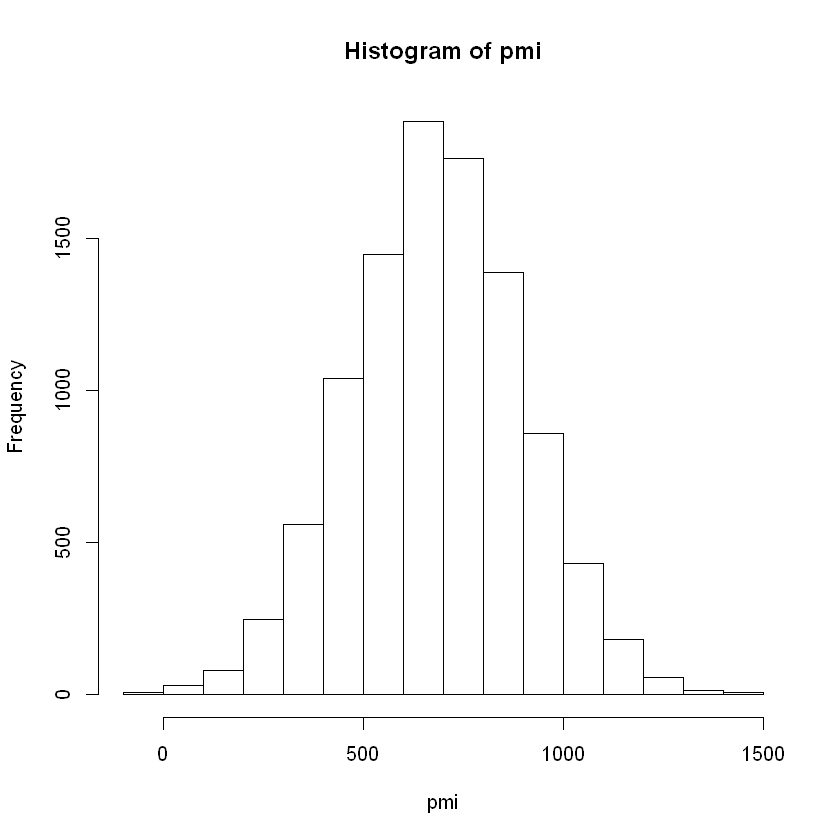
Using the PMI methodology, we are given the following formulas1:
\[\text{mean} = \frac{a+4b+c}{6}\] \[\text{sd} = \frac{c-a}{6}\]PMI proposes using z scores to determine where 95% of the values would lie given a normal distribution, using the mean calculated and standard deviation defined above. To keep things simple, we will use the same quantile methodology as before.
mean = (a + (4 * b) + c) / 6
sd = ((c - a) / 6)
pmi <- round(rnorm(10000, mean, sd), digits = 2)
quantile(pmi, c(.05, .50, .95))
This gets us quantiles of 5% 331.7395 50% 684.34 95% 1035.309, as well as a nice parametric distribution.
To sum it up, we have the following results:
| PMI | PERT | Triangular | |
|---|---|---|---|
| 5% | 331.7395 | 323.94 | 361.325 |
| 50% | 684.34 | 663.6 | 735.87 |
| 95% | 1035.309 | 1100.46 | 1259.053 |
So which method is the most accurate? That’s hard to say. I was surprised the PMI methodology got similar results to the PERT beta smoothed methodology, but I guess that is central limit theorem in action. All methods ranked probability of the extremes very low, but all three methodologies showed their bias towards the most likely scenario. Given that expert input would place some probability at both the optimistic and pessimistic, it would be interesting to compare the modeled probability with that of the expert. I would imagine its probably not \(.001\) (see this chart on how people interpret probabilistic words). Given the results, I would probably recommend padding the expert estimates to capture them within the model to the probabilistic interval they would attribute them to.
Having said that, all of this is subject to the quality of the estimates, which probably contains enough margin or error that the nuance in the equations is negligible. There is some guidance on the use of these formulas. Vose points to some research from Stanton & Farnum that to use the PMI standard deviation methodology, then the mode cannot lie more than 13% of the range from the distance to the optimistic or pessimistic value5. Thus, highly skewed estimates are subject to increased error in estimation.
In conclusion, I was surprised by the results here—the math seems to work out in the end, contingent on the accuracy of the estimates. The only area of improvement is possibly developing a function to pad the upper and lower estimates to get them at a probability in the model that is more aligned with the expert’s intent. Until then, happy project management activity forecasting!
-
Project Management Institute. (2017). A guide to the project management body of knowledge (PMBOK guide). Newtown Square, PA: Project Management Institute. ↩ ↩2
-
RiskAMP. (2019). The beta-PERT Distribution. [online] Available at: https://www.riskamp.com/beta-pert [Accessed 22 Sep. 2019]. ↩ ↩2 ↩3
-
Vose, D. (2008). Risk analysis: a quantitative guide. John Wiley & Sons. ↩ ↩2 ↩3
-
Millard, S. P. (2014). EnvStats, an R Package for Environmental Statistics. Wiley StatsRef: Statistics Reference Online. ↩
-
Farnum, N. R., & Stanton, L. W. (1987). Some results concerning the estimation of beta distribution parameters in PERT. Journal of the Operational Research Society, 38(3), 287-290. ↩